Analytics Introduction
Analytics provides comprehensive insights into how your content performs across the Streams Platform, helping you understand audience engagement and optimize your content strategy with data-driven decisions.
What is Analytics?
The Streams Platform Analytics feature gives you detailed metrics and insights about your content performance. While the long-term vision includes comprehensive analytics across websites, posts, ads, widgets, and streams, the current focus is on Streams analytics with expansion planned for other content types.
Navigation and Organization
Analytics are accessible through the main sidebar under the Marketing tab, with a secondary panel offering filterable sections:
- Streams - Performance metrics for your Stream collections
- Widgets - Engagement data for embedded components
- Website - Site performance and visitor analytics
- Community - Audience engagement and growth metrics
- Ads - Campaign performance and ROI tracking
Hierarchical Organization
Content is organized for easy navigation:
- Categories - Group related content
- Year - Based on content update timestamps
- Month - Monthly breakdowns for trend analysis
- Specific Items - Individual streams, widgets, or campaigns
Subscription-Based Metrics
Analytics features are tiered based on your subscription level, ensuring you get the insights appropriate for your business needs.
Basic Metrics (All Subscription Levels)
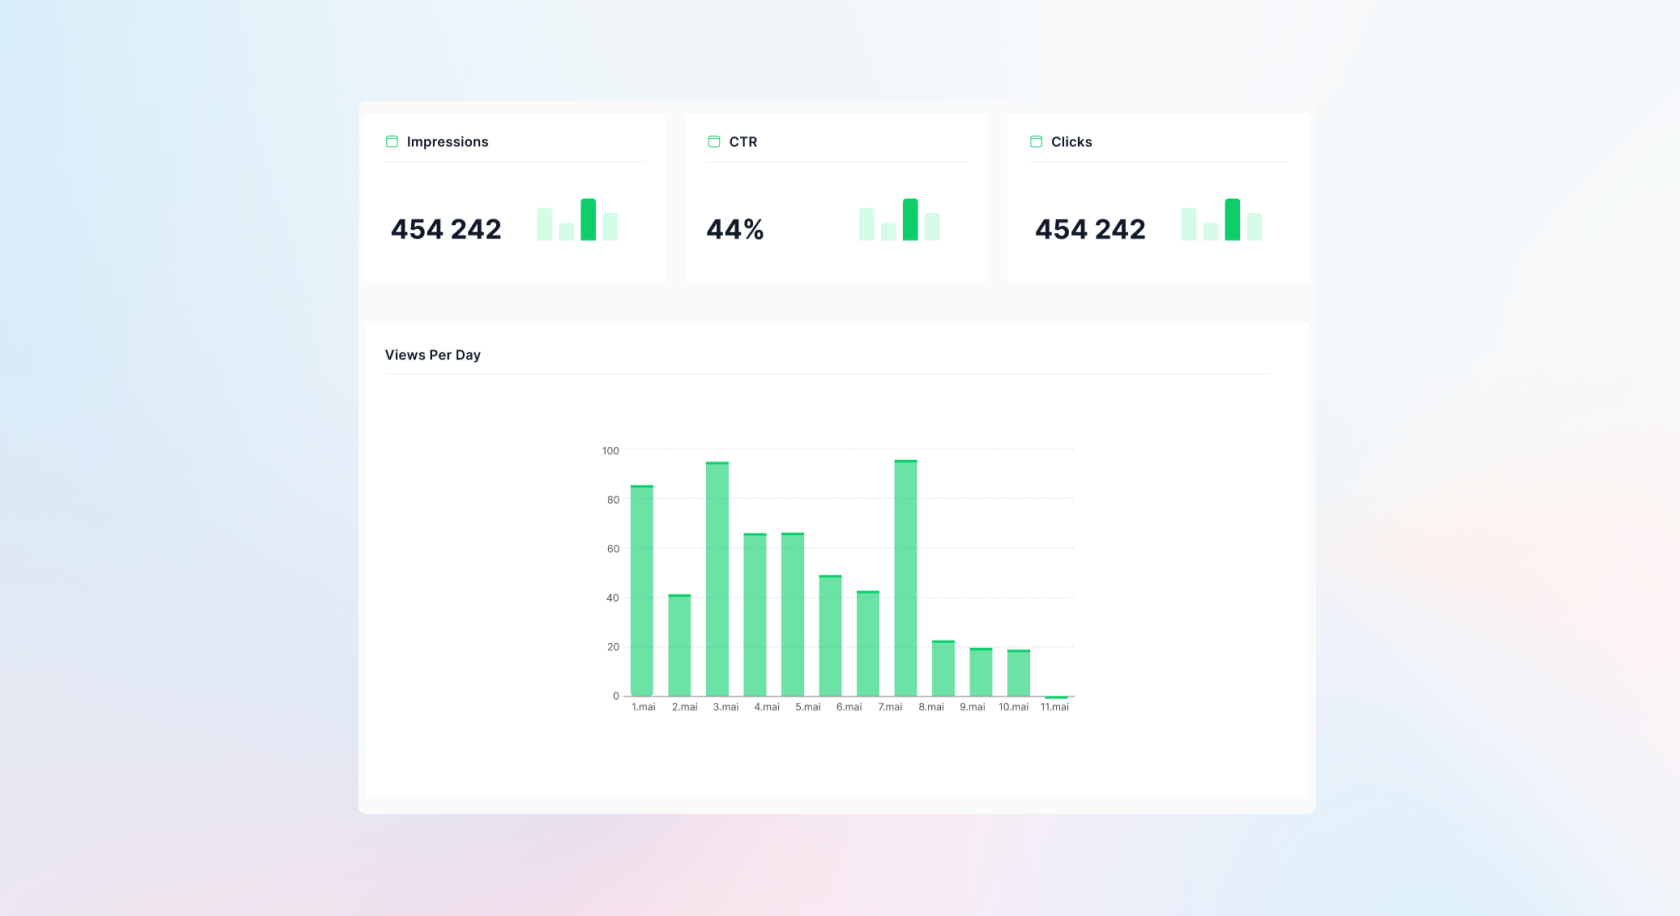
Impressions Total number of times your stream tiles were displayed in viewports, giving you visibility into content reach.
Click-Through Rate (CTR) Percentage of impressions that resulted in clicks, helping you understand content appeal and positioning effectiveness.
Clicks Total number of clicks on stream tiles, providing direct engagement measurement.
Views Per Day Daily breakdown of stream views with visual charts showing performance trends over time.
Premium Metrics (Professional, Small Enterprise, and Enterprise Plans)
Average Scroll Depth Measures how far users scroll through your stream content on average, with 100% calculated when users reach the final page. This metric helps you understand content consumption patterns.
Returning Users Number of unique users who viewed your streams multiple times, indicating content value and audience loyalty.
Top Performing Stream Page Identifies your highest engagement pages with total view counts, helping you understand what content resonates most.
Average Engagement Time Tracks how long users spend actively engaging with your streams, providing insights into content quality and audience interest.
Short Video Engagement Metrics Detailed performance table showing metrics specific to video content, including play rates, completion rates, and interaction data.
Product Engagement Analytics for products featured in your content, showing which items generate the most clicks and engagement.
Event Tracking System
Analytics uses a comprehensive event tracking system to capture user interactions:
Core Events
Stream Tile Impression Triggered when stream tiles become visible in the user's viewport, typically through embedded widgets.
Stream Tile Click Captures user clicks on stream tiles, indicating initial interest and engagement.
Stream View Start Records when users open the stream player and view the first page, measured once per session.
Stream Page View Tracks each time a specific stream page is loaded or viewed, providing detailed consumption analytics.
Product Impression Monitors when product cards become visible in the viewport, whether in pages or sidebars.
Product Click Records clicks on product cards with redirect tracking, measuring commercial engagement.
Data Visualization
Analytics presents data through multiple visualization formats:
Metric Cards
Current values with trend indicators showing performance changes over time.
Bar Charts
Time-based analysis showing daily, weekly, or monthly performance trends.
Percentage Displays
Engagement metrics presented as percentages for easy comparison and benchmarking.
Tabular Data
Detailed tables for product performance, video metrics, and other complex data sets.
Technical Implementation
Data Security
- Organization-scoped - All analytics data is isolated by organization
- User-level anonymization - Individual user data is anonymized for privacy
- GDPR compliance - Built-in compliance features for data collection and processing
Integration Considerations
API and NPM Package Tracking
For organizations using direct API integration or NPM packages rather than widgets, special consideration is needed for tracking stream tile impressions and ensuring complete analytics coverage.
Real-time vs. Batch Processing
While most metrics are processed in scheduled batches for efficiency, the system is designed to accommodate real-time processing needs as the platform scales.
Getting Started with Analytics
To make the most of your analytics:
- Content Strategy - Ensure your streams and content are properly tagged and categorized
- Goal Setting - Define what success looks like for your content
- Regular Review - Establish a routine for checking and acting on analytics insights
- Subscription Alignment - Choose the subscription tier that provides the analytics depth you need
Analytics transforms your content performance data into actionable insights, helping you create more engaging experiences and drive better business results.